2.2.3How do limits and continuity relate?
Definition of Continuity

The Three Conditions of Continuity
Continuity is an important concept in calculus because many important theorems of calculus require functions to be continuous over the interval of interest. Simply stating that you can trace a graph without lifting your pencil is neither a complete nor a formal way to justify the continuity of a function at a point.
In order to justify that a function

A function is continuous over an interval if it is continuous at each point in the interval.
Examine the conditions of continuity given in the Math Notes box above and summarize them with your team. Then demonstrate your understanding of continuity by sketching functions for parts (a) through (c).
Sketch a function that satisfies condition 1, but not condition 2 (and therefore not condition 3).
Sketch a function that satisfies condition 2, but not conditions 1 or 3.
Sketch a function that satisfies conditions 1 and 2, but not condition 3.
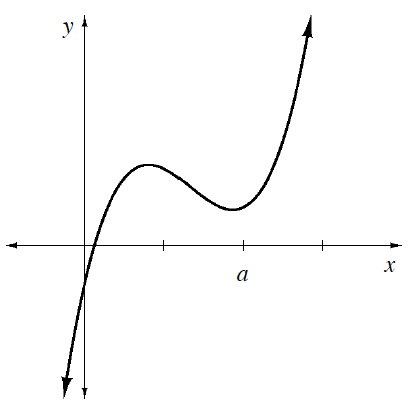
Examine the graph at right. Identify four values of
.png)
If
Use the three conditions of continuity to justify why
While waiting for a bus, you and your friends see a car traveling at
True of false: While breaking, the driver traveled at every intermediate speed between
mph and mph. Must the graph of this situation be a continuous function?
.png)
Explain why a function that is continuous for all
.png)
Intermediate Value Theorem
Let
.png)
Examine the function shown below. Notice that
.png)
For some continuous function

A helium balloon is released from the ground and floats upward. The height of the balloon is shown at the following times: Homework Help ✎
Time (s) | |||||||||||
Height (feet) |
What is the average velocity over the first
seconds of the balloon’s flight? Over the first seconds? Calculate the finite differences for the heights. How is the velocity changing? Explore this using the 2-81 HW eTool.
What do the finite differences tell you about the height function for the balloon?
Examine the expanded sums below and write the equivalent sigma notation. Homework Help ✎
The Intermediate Value Theorem is sometimes used to prove that roots exist. For example,
Write a Riemann sum for a general function
rectangles
rectangles
rectangles
Jamal wrote the following Riemann sum to estimate the area under
Draw a sketch of the region. How many rectangles did he use?
For what domain of
did Jamal estimate the area? Use the summation feature of your calculator to approximate the area using Jamal’s Riemann sum.
The manager of Books-To-Go knows that the rate of daily sales (in books per day) varies over the course of a week. This rate can be represented by the step function shown in the graph below. Using this data, calculate how many books this store sold during this week. What is the average number of books sold per day? Homework Help ✎
.png)
.png)
For each description below, write a limit equation and sketch a possible function. Homework Help ✎
As
. As
gets closer to on both sides, becomes increasingly large. Which of the limits from parts (a) and (b) exist? Explain your reasoning.
Given
Sketch
. For what values of
is not continuous?


